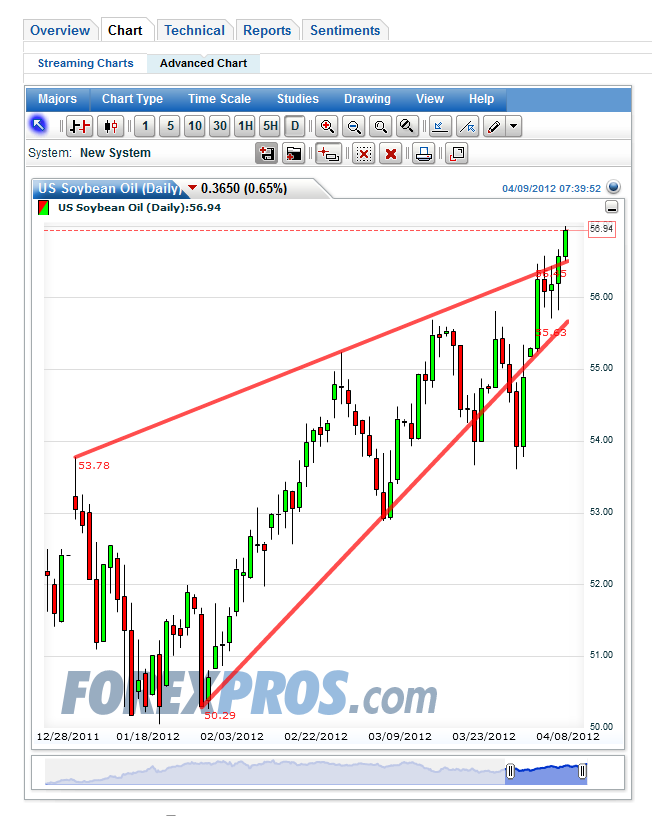
Monday, 9 April 2012

9/4/2012 ; Soyabean oil daily chart ; 56.94

Soybean oil made a new high this morning, in fact it broke above the 'rising wedge' formation indicating signs of a renewed strength in price movement.

Saturday, 7 April 2012

7/4/2012 ; Soybean daily bar chart.

A picture shows a thousand words. Food for thought. If  the chart of soybeans looks like that. Can FCPO make a pattern  just like that?

Wednesday, 4 April 2012

4/4/2012 ; 60 min chart ; 3557

Bullish still ; even though open lower, but still recorded a new higher high and higher low and closed above all moving averages. In-fact a new stronger channel line was established.

Monday, 2 April 2012

2/4/2012 ; 60 min chart ; 3532

Bullish still. Open gap-up and recorded a new higher high due to soy oil's strength closing last friday. Brake above both the bullish flag and the falling wedge and closed near the highs above the moving averages.

2/4/2012 ; 60 min char ; 3433

Market correction almost over. Formed a 'bullish flag' within a 'falling wedge'. Bearish if still within flag or wedge. Bullish if breakout above. I have entered another long position last friday anticipating market may move higher this week.

Friday, 23 March 2012

60 min chart ; 3426

Bullish - Renewed strength with very high volume indicates correction is over and recorded a new higher high. Market has 'rebounded' after a 'pullback' gives opportunity to re-enter long position. The price has gone above all the Moving Averages. Support ; 3418 ,3383, 3359. Resistance ; 3464,3489 , 3532.