Tuesday, 31 January 2012
31/1/12; FCPO- 3178.
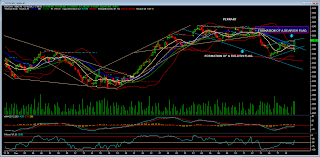
Opened gap down and recorded a new low of 3044 and lower high even though closed off the highs. Chart pattern now forming a new enlarged 'falling wedge'. Market will be sideways to lower if within wedge, bearish if break down, bullish if break up. Support; 3044,3020, 2980. Resist; 3100, 3146, 3190. Range target; 3030-3082.
Monday, 30 January 2012
30/1/12; 60 min chart.; FCPO -3082
Broke down from the 'bearish flag' at the opening and bearish at both sessions today. Recording a new lower low of 3179 and closed near the lows with comparatively larger volume. From a 'bearish flag' now forming a 'falling wedge'. Support; 3052,3020,2980 . Resist; 3128, 3190,3205.
Saturday, 28 January 2012
28/1/12 ; 60 min chart
3135 ; Market moved in a tight range with lesser volume still after succumbed to selling pressure the day before due to negative export figures. From a rising wedge now forming a bearish flag. Market direction will be side way for now until prices breakout from the flag. Support; 3097. 3052, 3020. Resist; 3190, 3205, 3244.
Friday, 27 January 2012
27/1/12 - 60 min chart ; 3131
Open higher but closed near the lows of the day. from a rising wedge, broke down and now formed a bearish flag. bullish if price within flag, bearish if break down. support; 3097, 3078. 3052. resistant; 3176, 3190, 3205.
Friday, 20 January 2012
20/1/12 - FCPO ; 3160
BORING! Not much movement coupled with lack of volume. Market is heading nowhere with all the wrong signals ahead of a long week-end. Support; 3143, 3097, 3052. Resistant; 3086, 3205, 3144.
Thursday, 19 January 2012
18/1/2012- 60 min chart
3180 ; closed at the high of the day after trading lower earlier. recorded a higher low and higher high. market looks bullish at the moment still not out of the woods yet. support ; 3143, 3097, 3052. resistant ; 3186; 3205; 3244.
Wednesday, 18 January 2012
60 min chart
3164 ; FCPO is not out of the woods yet. Bullish the whole day and closed near the highs. From a pennant now formed a bullish flag which means bearish if price within the flag but bullish if breakout above. Support; 3143,3097,3052. Resistant; 3176, 3205,3244.
Sunday, 15 January 2012
60 min chart
FCPO 3151; Open gap-down and closed near the lows. Broke down from the Pennant means this is not just a mere correction - maybe a short term downtrend. With last Friday's fall on soya oil price at CBOT, can expect more retracement. If 3140 breaks, next support will be 3097, then 3052. Resistance ; 3176,3295,3244.
Thursday, 12 January 2012
WELCOME
I am a full time FCPO (futures crude palm oil) trader. I will try my best to record all my trades here in this blog. Feel free to give comments and share ideas to improve this blog.
Subscribe to:
Posts (Atom)


